
Adore Gremlin, because we love to produce order
After meeting up with Gremlin at Kubecon I told myself; we should definitely take a closer look at the concept of Chaos Engineering. A field of which the name does not accurately reflect the meaning. After all, Chaos is subjective. According to the Cambridge Dictionary, the word Chaos means ‘a state of total confusion with no order.’ With Gremlin, you can run Chaos Engineering experiments against hosts, containers and more! To me, Gremlin is an excellent tool to find your antidote to Chaos. Gremlin brings order and takes away confusion, nullifying Chaos. Picture yourself as a SRE in the following two situations:
Situation 1
You get called at 3 AM on a weekday to assist with an outage. After booting up and dialing into the problem phone bridge, you are brought up to speed on what problems they are facing with a Kubernetes cluster. You notice that API A is being throttled (CPU), because of the high number of requests coming in. Because of that, API B from another team is constantly being OOM-killed as it cannot process any messages without accessing API A. Normally API-B has no problem at all but because it cannot talk to API A, work keeps piling up and is being (unfortunately) held in memory, eventually OOM-Killing the container. You found this out whilst barely awake and your manager and the client are pressuring you to solve the problem quickly. You eventually explain to your manager that you could solve the problem by adjusting the production workload deployment configuration by either adjusting CPU or Memory temporarily in order to process all the messages. After doing that, your manager forces you to find out if any data loss might have occurred. You will also have to sit together with the DevOps teams that are responsible for API A and API B to prevent anything like this from happening in the future.
Situation 2
You wake up at a reasonable hour to get ready for work. You get into the office and your four first cup of coffee. You check the story backlog and remember that you were working on testing the combination of API A and API B. You apply Chaos Engineering best practices. You plan and play out a Gremlin scenario where API A has high CPU Load due to the number of requests coming in. You notice that API B eventually breaks down and keeps trying to process messages after it is constantly being OOM-Killed. You explain what happened to your manager after you safely stop Gremlin wreaking havoc, making the environment return to its normal state. You discuss your findings with the DevOps teams responsible for API A and API B and take action to prevent this scenario from ever happening.
Having read these two scenarios. Which one of these two scenarios comes closest to the definition of Chaos? In which one of these two SRE’s shoes would you rather be? No further explanation needed, right? However, if you are still not convinced. Let us check what might be considered undesirable when it comes to Scenario 1:
- You wake up at 3 AM
- You must troubleshoot whilst under pressure, prolonging the troubleshooting sessions as you overlook certain aspects that otherwise would not have been overlooked.
- You must adjust API A and API B production deployment configurations and, all checks and balances go out the window and you simply adjust code to temporarily solve the problem.
- You end up having to stay up as your manager forces you to confirm no data loss occurred.
- After a short night you try to stay positive and sit in a conference call together with DevOps teams and/or other SRE’s responsible for API A and API B. You explain what needs to be fixed. Those DevOps teams end up delaying functionality that the business is desperately waiting for. Unfortunately, this new functionality must wait as API A and B need to be fixed, tested, and released to production due to this change taking priority.
Most of us have been in situations like these before. As an SRE myself, Scenario 1 reminds me of when I was still a humble Network Engineer at a fortune 500 company. True Chaos only occurs when you are unprepared. Gremlin provides you with the tools to break production or production like environments, allowing you to witness what might happen to your infrastructure, middleware or applications. It also allows you to play out problem scenarios to find out if your processes are in place to facilitate troubleshooting or further escalations.
After I contacted Gremlin, I asked if I could test Gremlin and see for myself how accessible they make Chaos Engineering best practices. After a brief introduction, I was provided with access to their cloud environment allowing me to instrument some of my infrastructure with Gremlin. When starting a Gremlin Scenario or Attack you are presented with information on how the Gremlin Scenario or Attack is playing out. But how can I confirm that what Gremlin is telling me is actually happening? Let us use Prometheus to collect metrics and visualize them with Grafana to confirm!
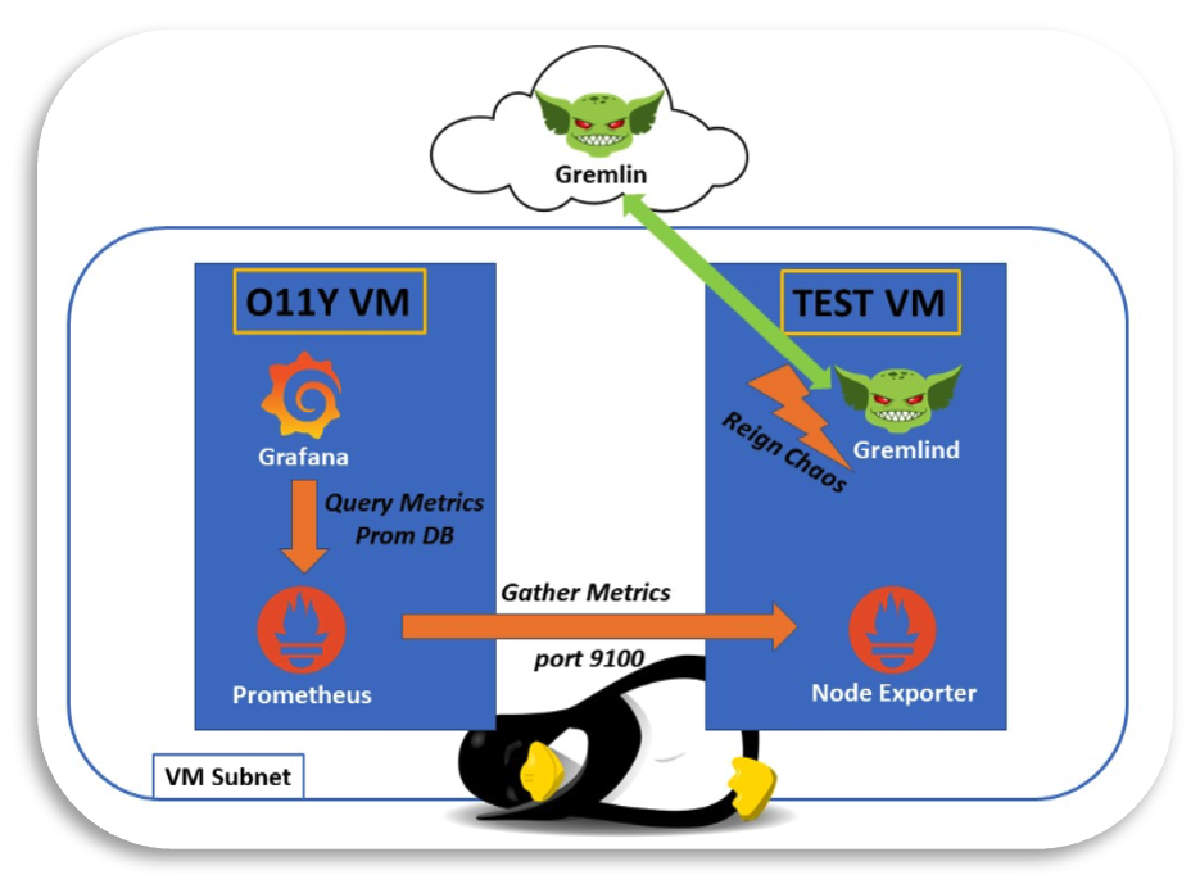
I decided to set up one VM called O11Y and another VM called TEST. The O11Y machine was provisioned with Ubuntu Desktop OS whilst the Gremlin machine was provisioned using the Ubuntu Server OS. The O11Y VM ran Prometheus and Grafana whilst the TEST VM only had the Node_Exporter running. This way, the TEST VM would not run anything but Node_Exporter and whatever was needed to run Gremlin Scenarios or Attacks. See a simplified drawing above of my setup. I then continued to setup Gremlin. After visiting app.gremlin.com I was provided with clear installation instructions right on the front page. A wonderful way to get started quickly!
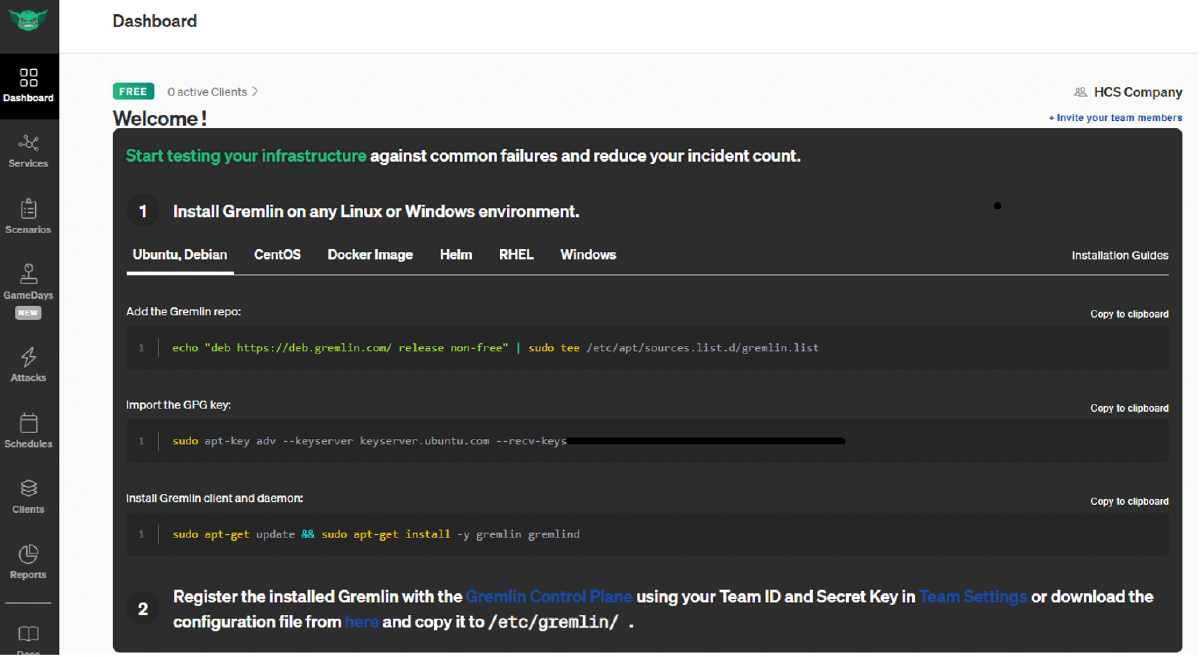
I then followed the above-mentioned gremlin steps to install and thereby also register the Gremlind endpoint to the app.gremlin.com cloud instance. Once everything was installed, I was able to see my TEST VM’s endpoint. I then followed the above-mentioned gremlin steps to register the gemlind endpoint to the app.gremlin.com cloud instance. Once connected you can see your machine in the console under the Clients tab, including some metadata:
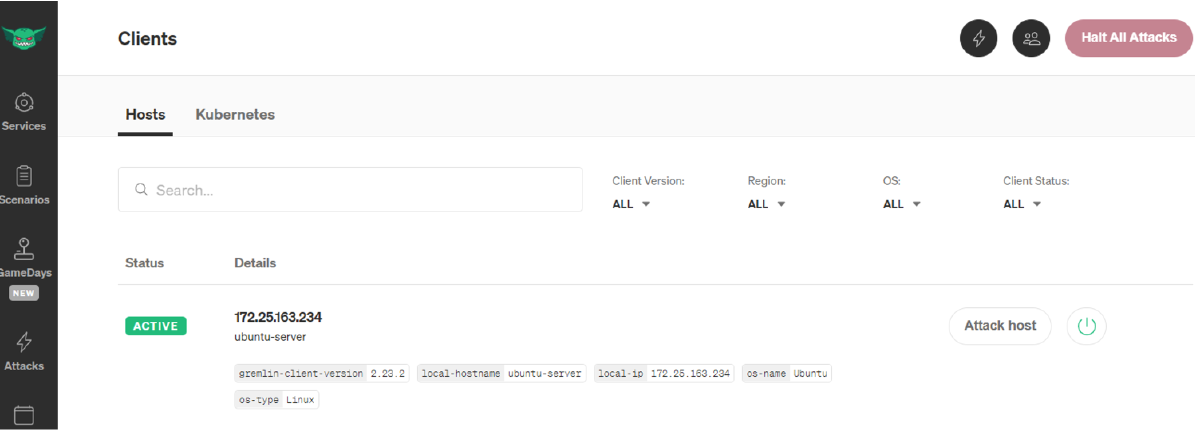
After clicking on “Attack Host” I was prompted to select more hosts containing any of the labels. As I only had a single host (the TEST VM) I chose to attack this single host to make sure Gremlin was set up properly. After that I was presented with the “new attack” window. Within this window you could see additional host related details and the ability to choose a Gremlin to start raining some Chaos on your target machine. I wanted to do a quick test to see if I could get my CPU of my host max out on 95% for some time whilst confirming this within the Grafana Dashboard. I had 6 CPU cores I could use. Gremlin allows you to selectively use only some cores, or to simply select them all. As I want to get my CPU to 95%, I simply selected “All cores”.
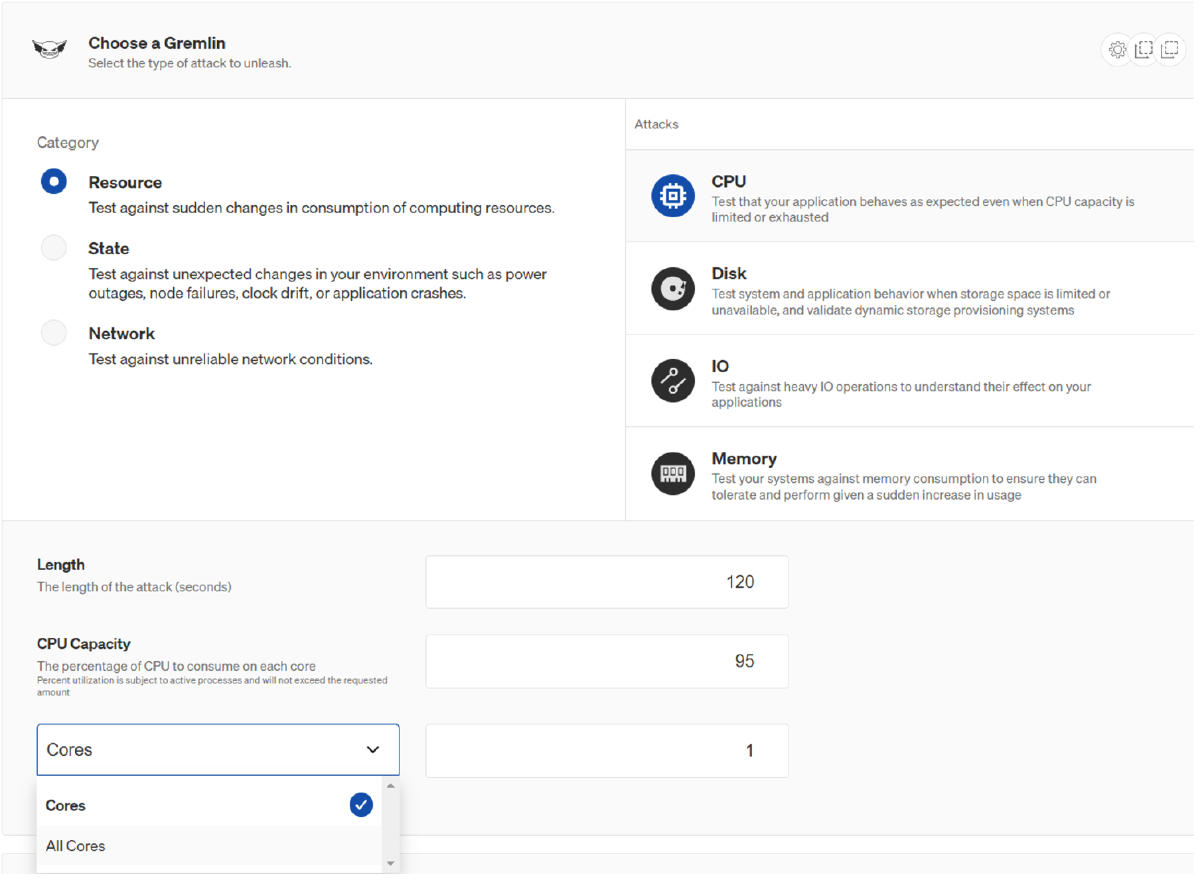
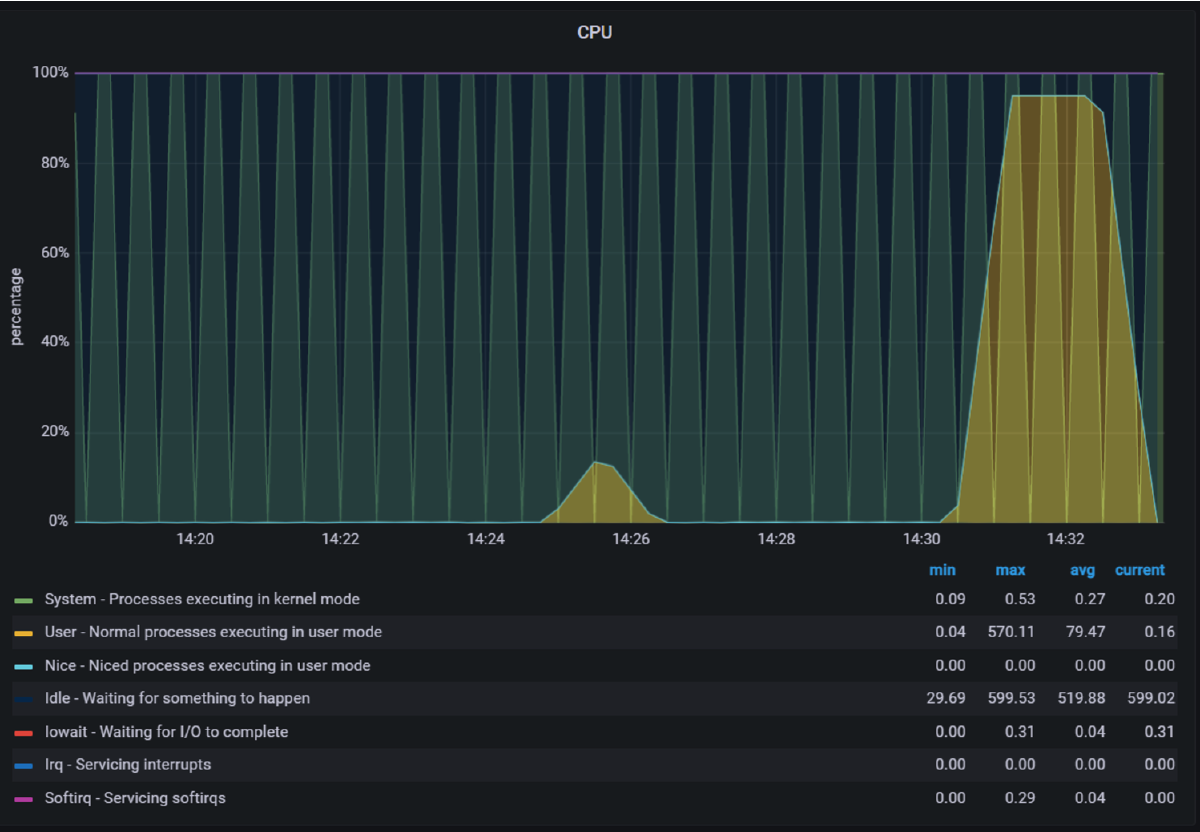
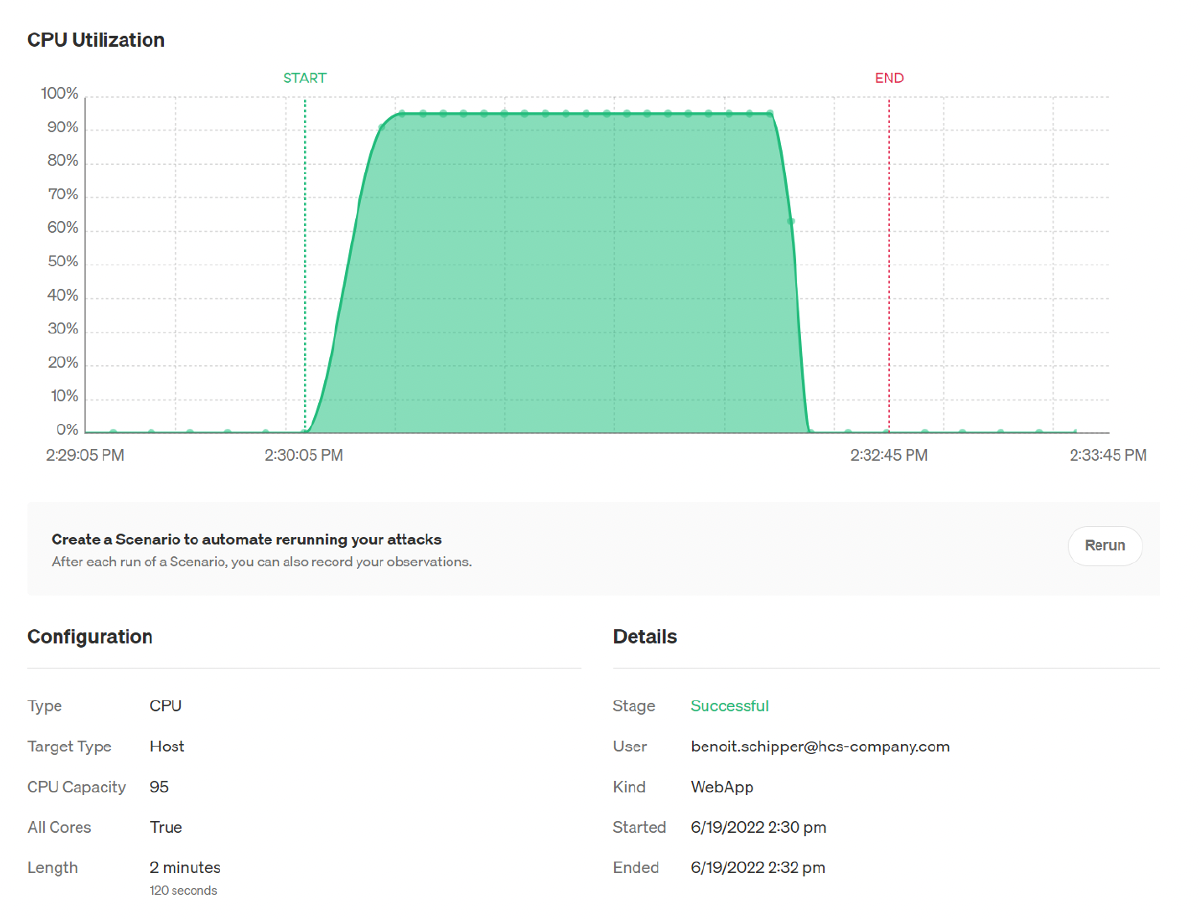
Once you have chosen your Gremlin you can run the attack by clicking on the “Unleash Gremlin” button. Without hesitation I just went for it. After shortly initializing, the Gremlin Attack Details page shows you exactly what is happening. Below, on the right side, you can see the Gremlin Attack. On the left you can see the Grafana Dashboard. And like magic, both Grafana and Gremlin state that my CPU was at 95% at the exact same time intervals, following the same curvature. I then noticed that my laptop started to go “brrrrrrr” as it was being attacked by a Gremlin.

See these two screenshots for more detail:
This Grafana screenshot shows a detailed version of the CPU 95% attack. Additionally, you can see that the CPU test was done in User mode.
The screenshot below shows an overview of your attack within the Gremlin web interface. When it started, when it ended, what the attack entailed, who initiated the Gremlin Attack and if it was successful.
Naturally, I wanted to try what else I could do besides CPU load tests. Turns out Gremlin has a variety of options. For all the options, check the documentation here. I did a couple more attacks to see what was happening and kept confirming what Gremlin was doing by meticulously fixating on my Grafana dashboard. I took a step back and was amazed that I only had to follow a few simple steps to instrument Chaos. But what if you want to run multiple tests in a row? No problem, Gremlin has got your back with their Gremlin Scenarios!
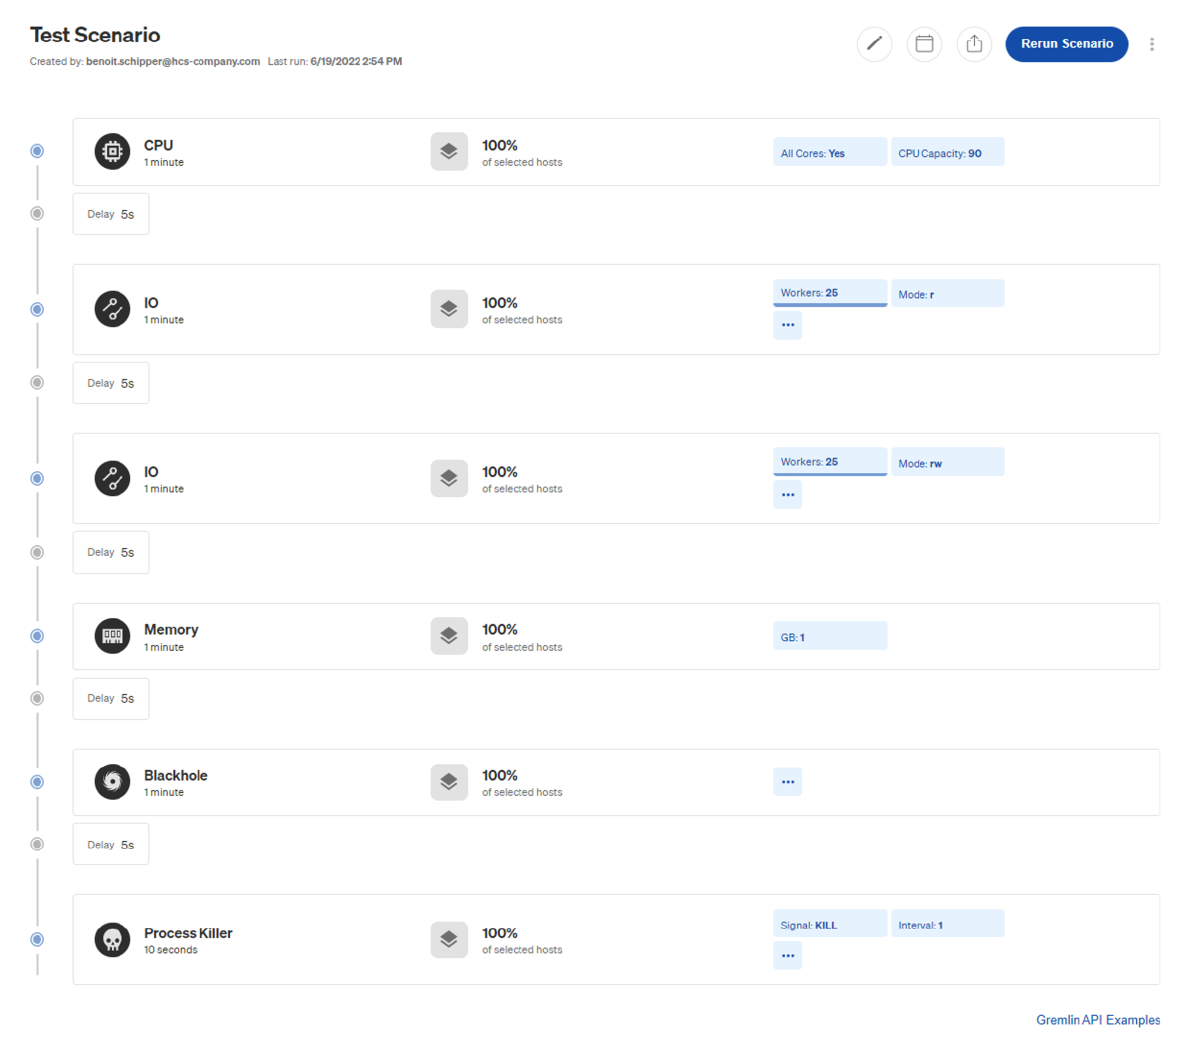
Using Gremlin Scenarios, you can launch multiple attacks in successive order. If one fails, the Scenario stops (by default). It also allows you to add delays in between the attacks for the machine to return to its desired “normal” state (if you did not trip the machine that is 😉). I wanted to unleash multiple Gremlins using a Gremlin Scenario whilst confirming if Grafana would show all the activity. I set up a Gremlin Scenario and unleashed the Chaos. The Gremlin Scenario would perform 6 tests, see below:
- CPU attack
- I/O disk read attack
- I/O disk read/write attack
- Memory attack
- Blackhole attack
- Process killer attack
Below you can see the results of these tests from Grafana’s point of view. Each subheading corresponds to the above-mentioned numbered list of tests.
1. The CPU Attack
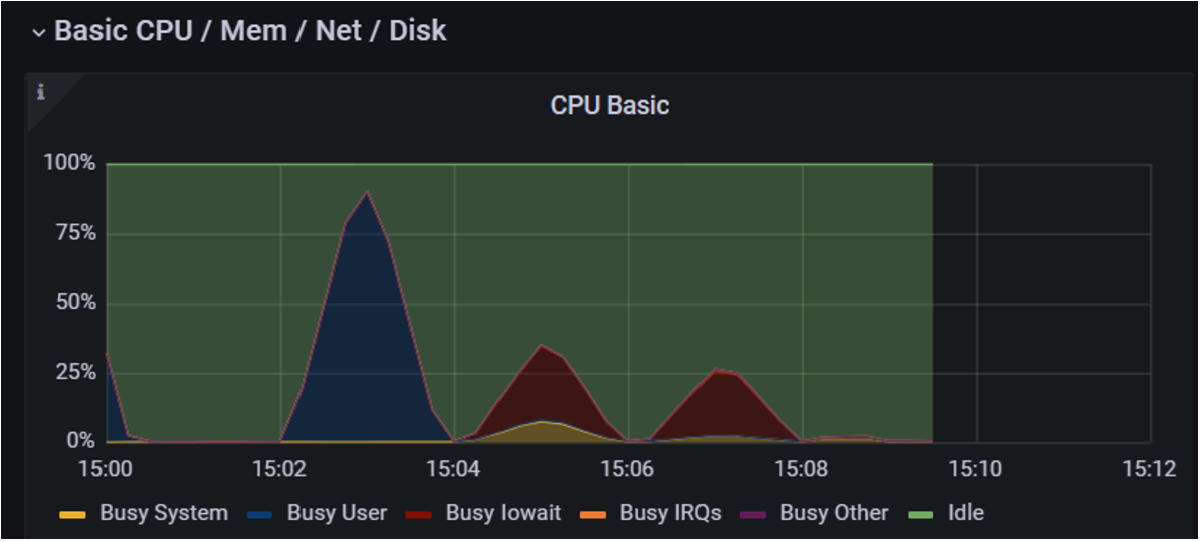
The first attack was the CPU attack. First my CPU spiked to 90% as mentioned in the Gremlin Test. Confirmed by the first big blue spike within the Grafana graph below.
2 and 3. Disk IO Tests
The scenario proceeded with a Disk/IO read attack, where 25 workers were trying to reproduce read I/O on /tmp. Followed by 25 workers that were trying to reproduce read/write I/O on /tmp. Confirmed by the green read and read/write spike within the Grafana graph below.
{< img src=“images/img9.png” alt=“Schermafbeelding 2022-08-15 om 10.59.34” >}}
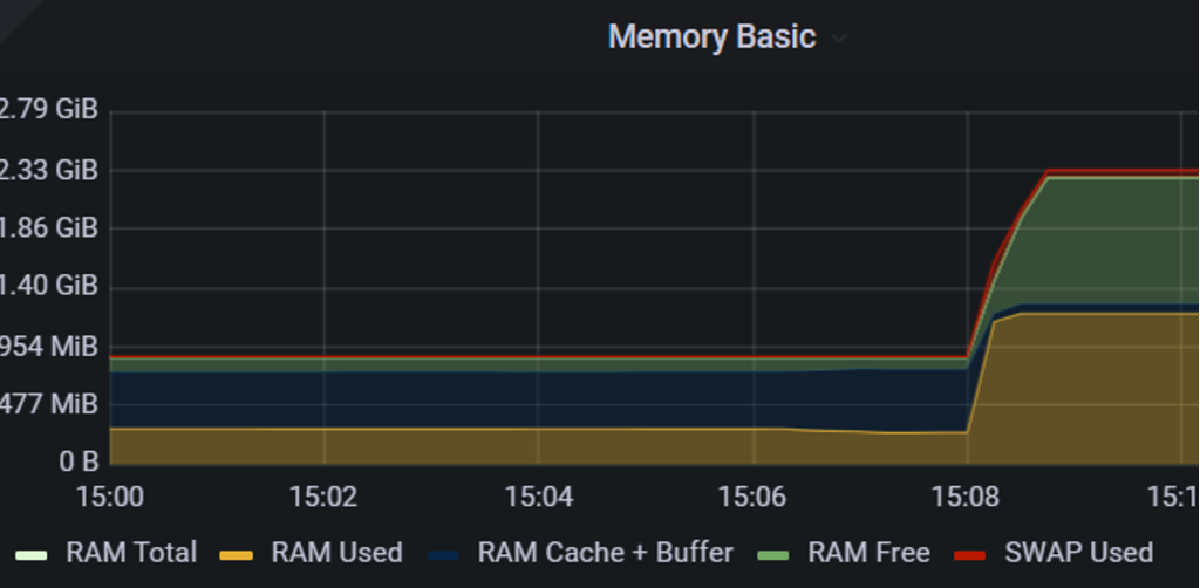
4. The Memory Attack
The scenario then proceeded with its 4th attack where 1 GB of ram was suddenly being hogged by a Gremlin. Again, confirmed by Grafana in the graph below.
5. The Blackhole Attack
The 5th attack represented a blackhole attack. I decided to blackhole the IP (the O11Y VM) from where I was hosting Prometheus/Grafana. This way I could easily confirm within Prometheus if anything would happen. Judge for yourself by checking the screenshot from Prometheus below 😉. Let us just say that metrics were not able to be scraped.

6. The Process Killer
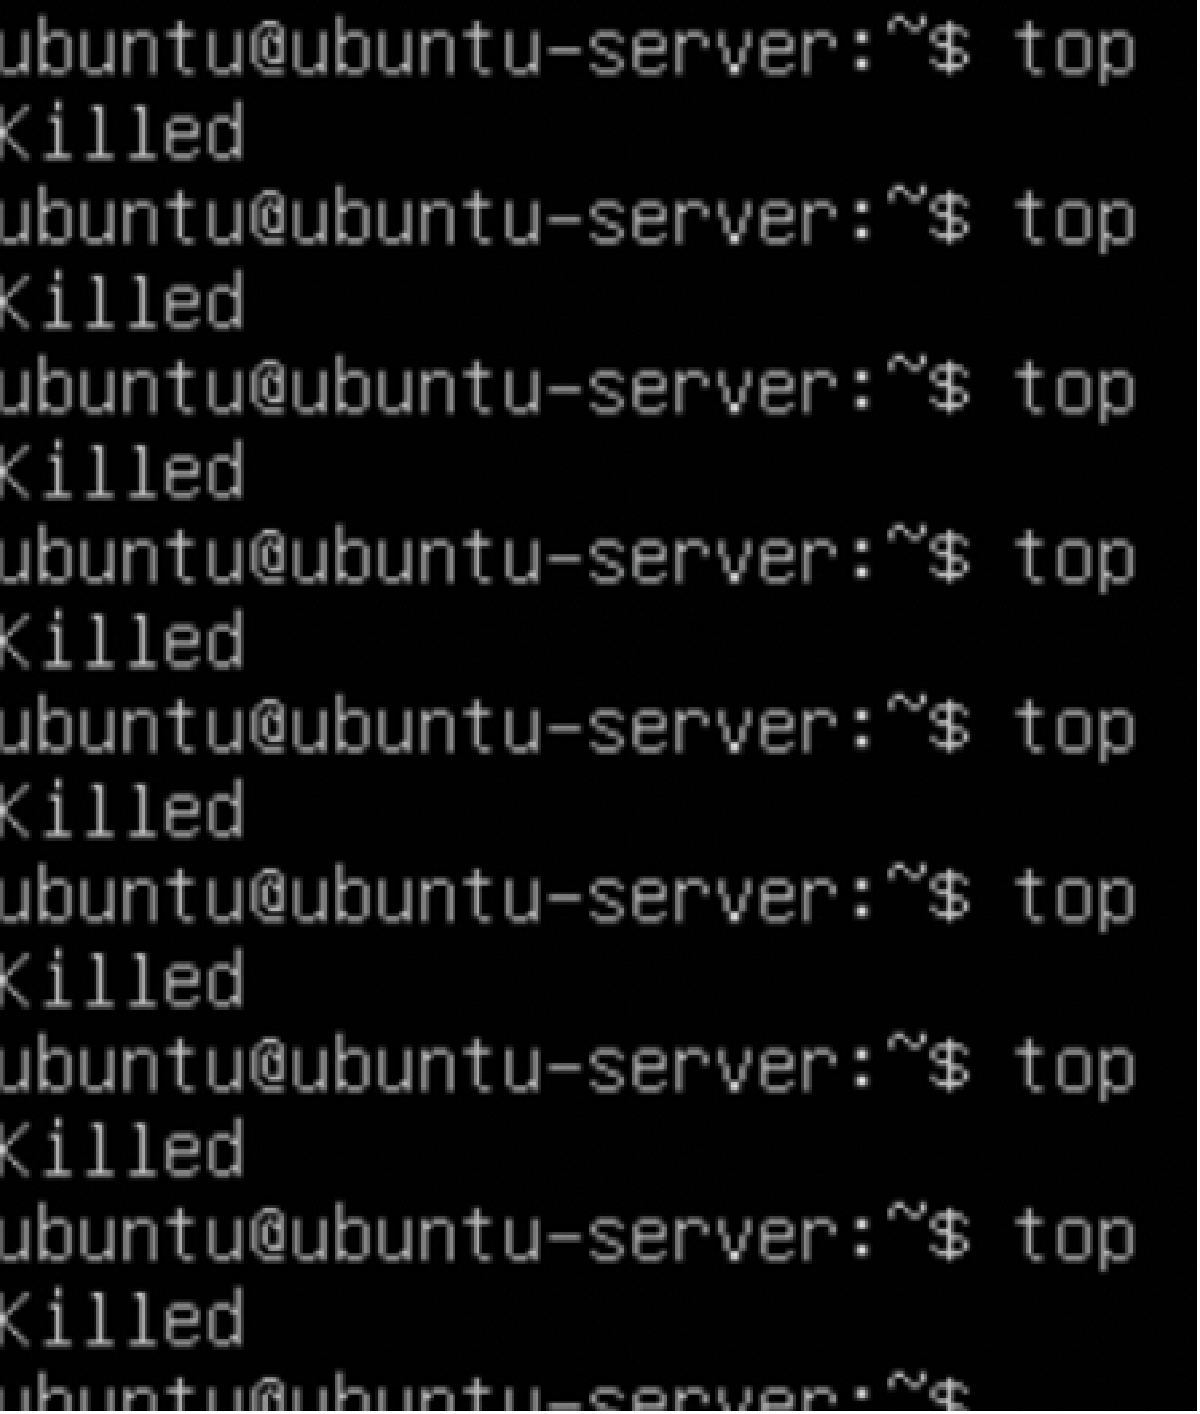
The 6th and final attack would be a process kill attack. As I wanted to keep it simple, I told Gremlin to kill all “top” processes on the TEST VM. Like this I could keep trying to open top to see what happens during the timespan the Gremlin was killing this process on my VM. In the screenshot below you can see that ”top” constantly kept being killed.
My scenario (consisting out of 6 Gremlin Attack) completed successfully, and I was able to check all attacks to see what happened. I could rerun the Scenario or run it again at any later stage.
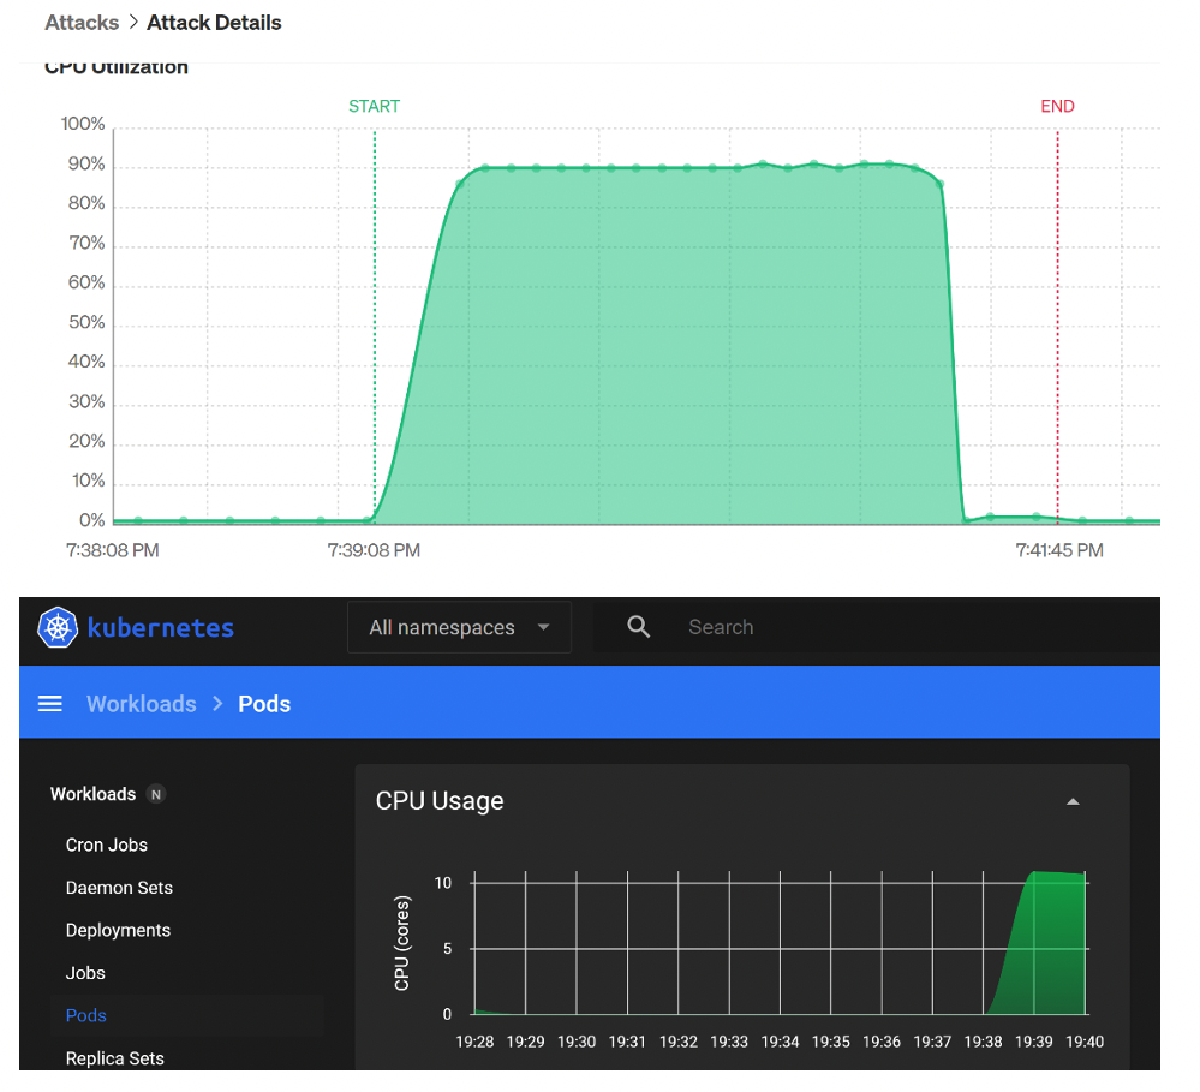
I then followed up with a Gremlin test on K3S to see what it could do within a Kubernetes like environment. And again, after an easy setup I was able to perform all kinds of interesting Gremlin Scenarios or Attacks on the cluster. I did this by setting up K3S on top of a bare metal installation of Ubuntu, confirming the Gremlin tests using the K3S Dashboard. You can then choose to install Gremlin within K3S by HELM Chart or manual deployment. There is even an OpenShift guide. You can see all options here. After setting up Gremlin by following their clear instructions my k3s cluster was seen within Gremlin and I proceeded with unleashing a CPU Gremlin.

Like with the VM’s I confirmed that the CPU test was using up lots of CPU resources. And like with Grafana I confirmed that with the K3S cluster Dashboard. For more detail, see the two screenshots below:
The latest feature that Gremlin added is called GameDays. A GameDay is an organized team event to practice Chaos Engineering, test your incident response process, validate past outages, or find unknown issues in your services. According to the Gremlin CEO Kolton Andrus (2022 - Article) “Gamedays are like fire drills – an opportunity to practice a potentially dangerous scenario in a safer environment. They are the capstone which allows us to measure the resilience of a system. Running a Gameday tests our company – from engagement to incident resolution, across team boundaries and job titles. “Check out the full article here, check the gremlin.com/docs for more information on GameDays or watch this video.
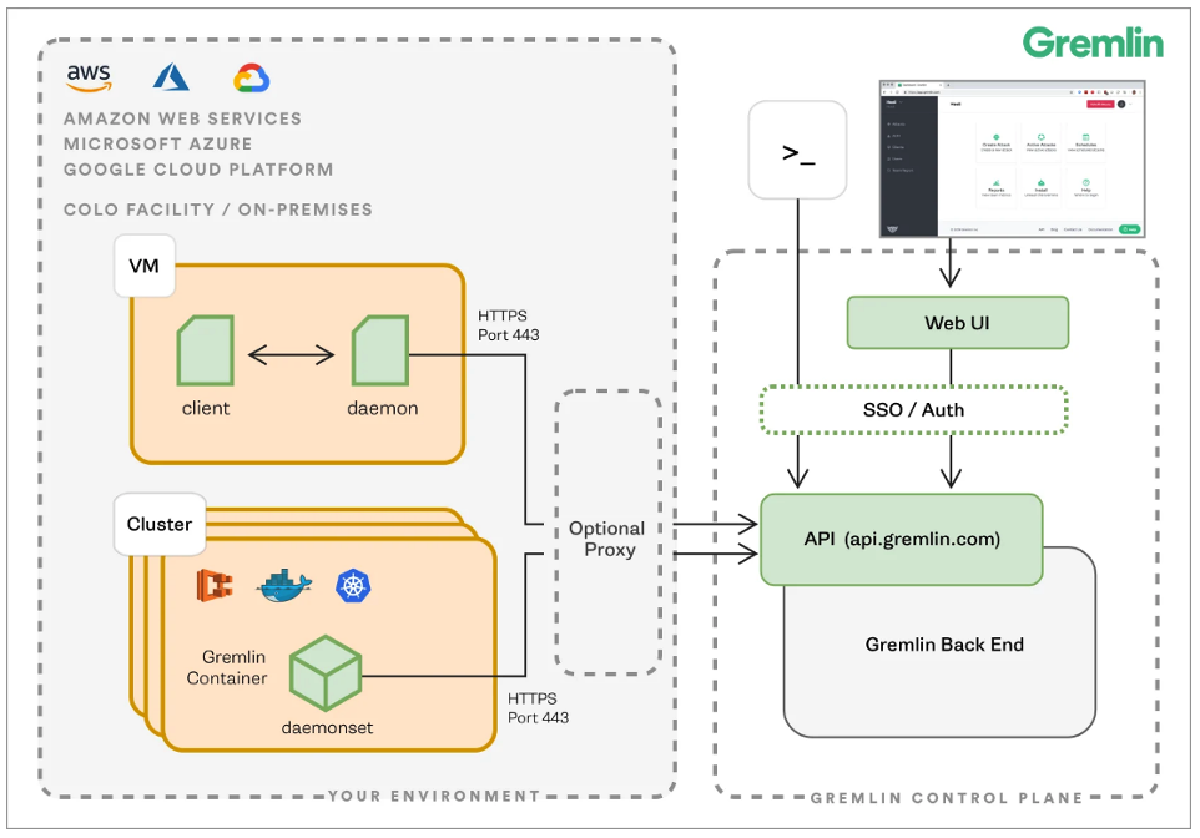 Besides a well-designed front-end and lots of great functionality. What about
the backend? Where is all this running? At this very moment, Gremlin is solely
available as a SAAS platform hosted within the US by the AWS cloud provider.
The fact that Gremlin is solely available as a SAAS product brings many
benefits. It is easy to start using straight away, you will not need to concern
yourself with hosting or installing Gremlin yourself or deal with lifecycle
management. However, it being solely hosted within the US region has some
drawbacks. Most government and lots of private organizations outside of the US
will be hesitant to utilize a SAAS product not hosted within their own region
due to data collection or other related concerns.
That does not take away however that this product makes Chaos Engineering easy for anyone who wants to have an easy, efficient, and productive way to prevent or reproduce production outages. If Gremlin were available for me as a tool within my organization, I would most definitely utilize their Gremlins in my pursuit for reliability. With the existence of Gremlin, there is no excuse not to!
Thank you for getting till the end of my blog! There are a bunch of free resources Gremlin makes available to the community:
- You can request a free trial by following this link.
- They also offer two free certification courses you can undertake. For more information on certification, check this page.
- If you convinced and are curious about potential costs, please contact mcmeekin@gremlin.com
- Gremlin Blog
- Gremlin Tutorials
- Gremlin Case Studies

 Benoit Schipper


